Digital Media Trends: First Half of 2020

There is no denying that 2020 has been, well, unpredictable. From the onset of COVID-19 to social justice movements, Backbone’s digital media team has been privy to the effects of these events on the active lifestyle industry. Overall, we have observed that digital media consumption has continued to shift throughout the first half of 2020 and e-commerce behavior has followed suit.
Digital Media Trends: 2020 In Review
January–April: Slowing Down
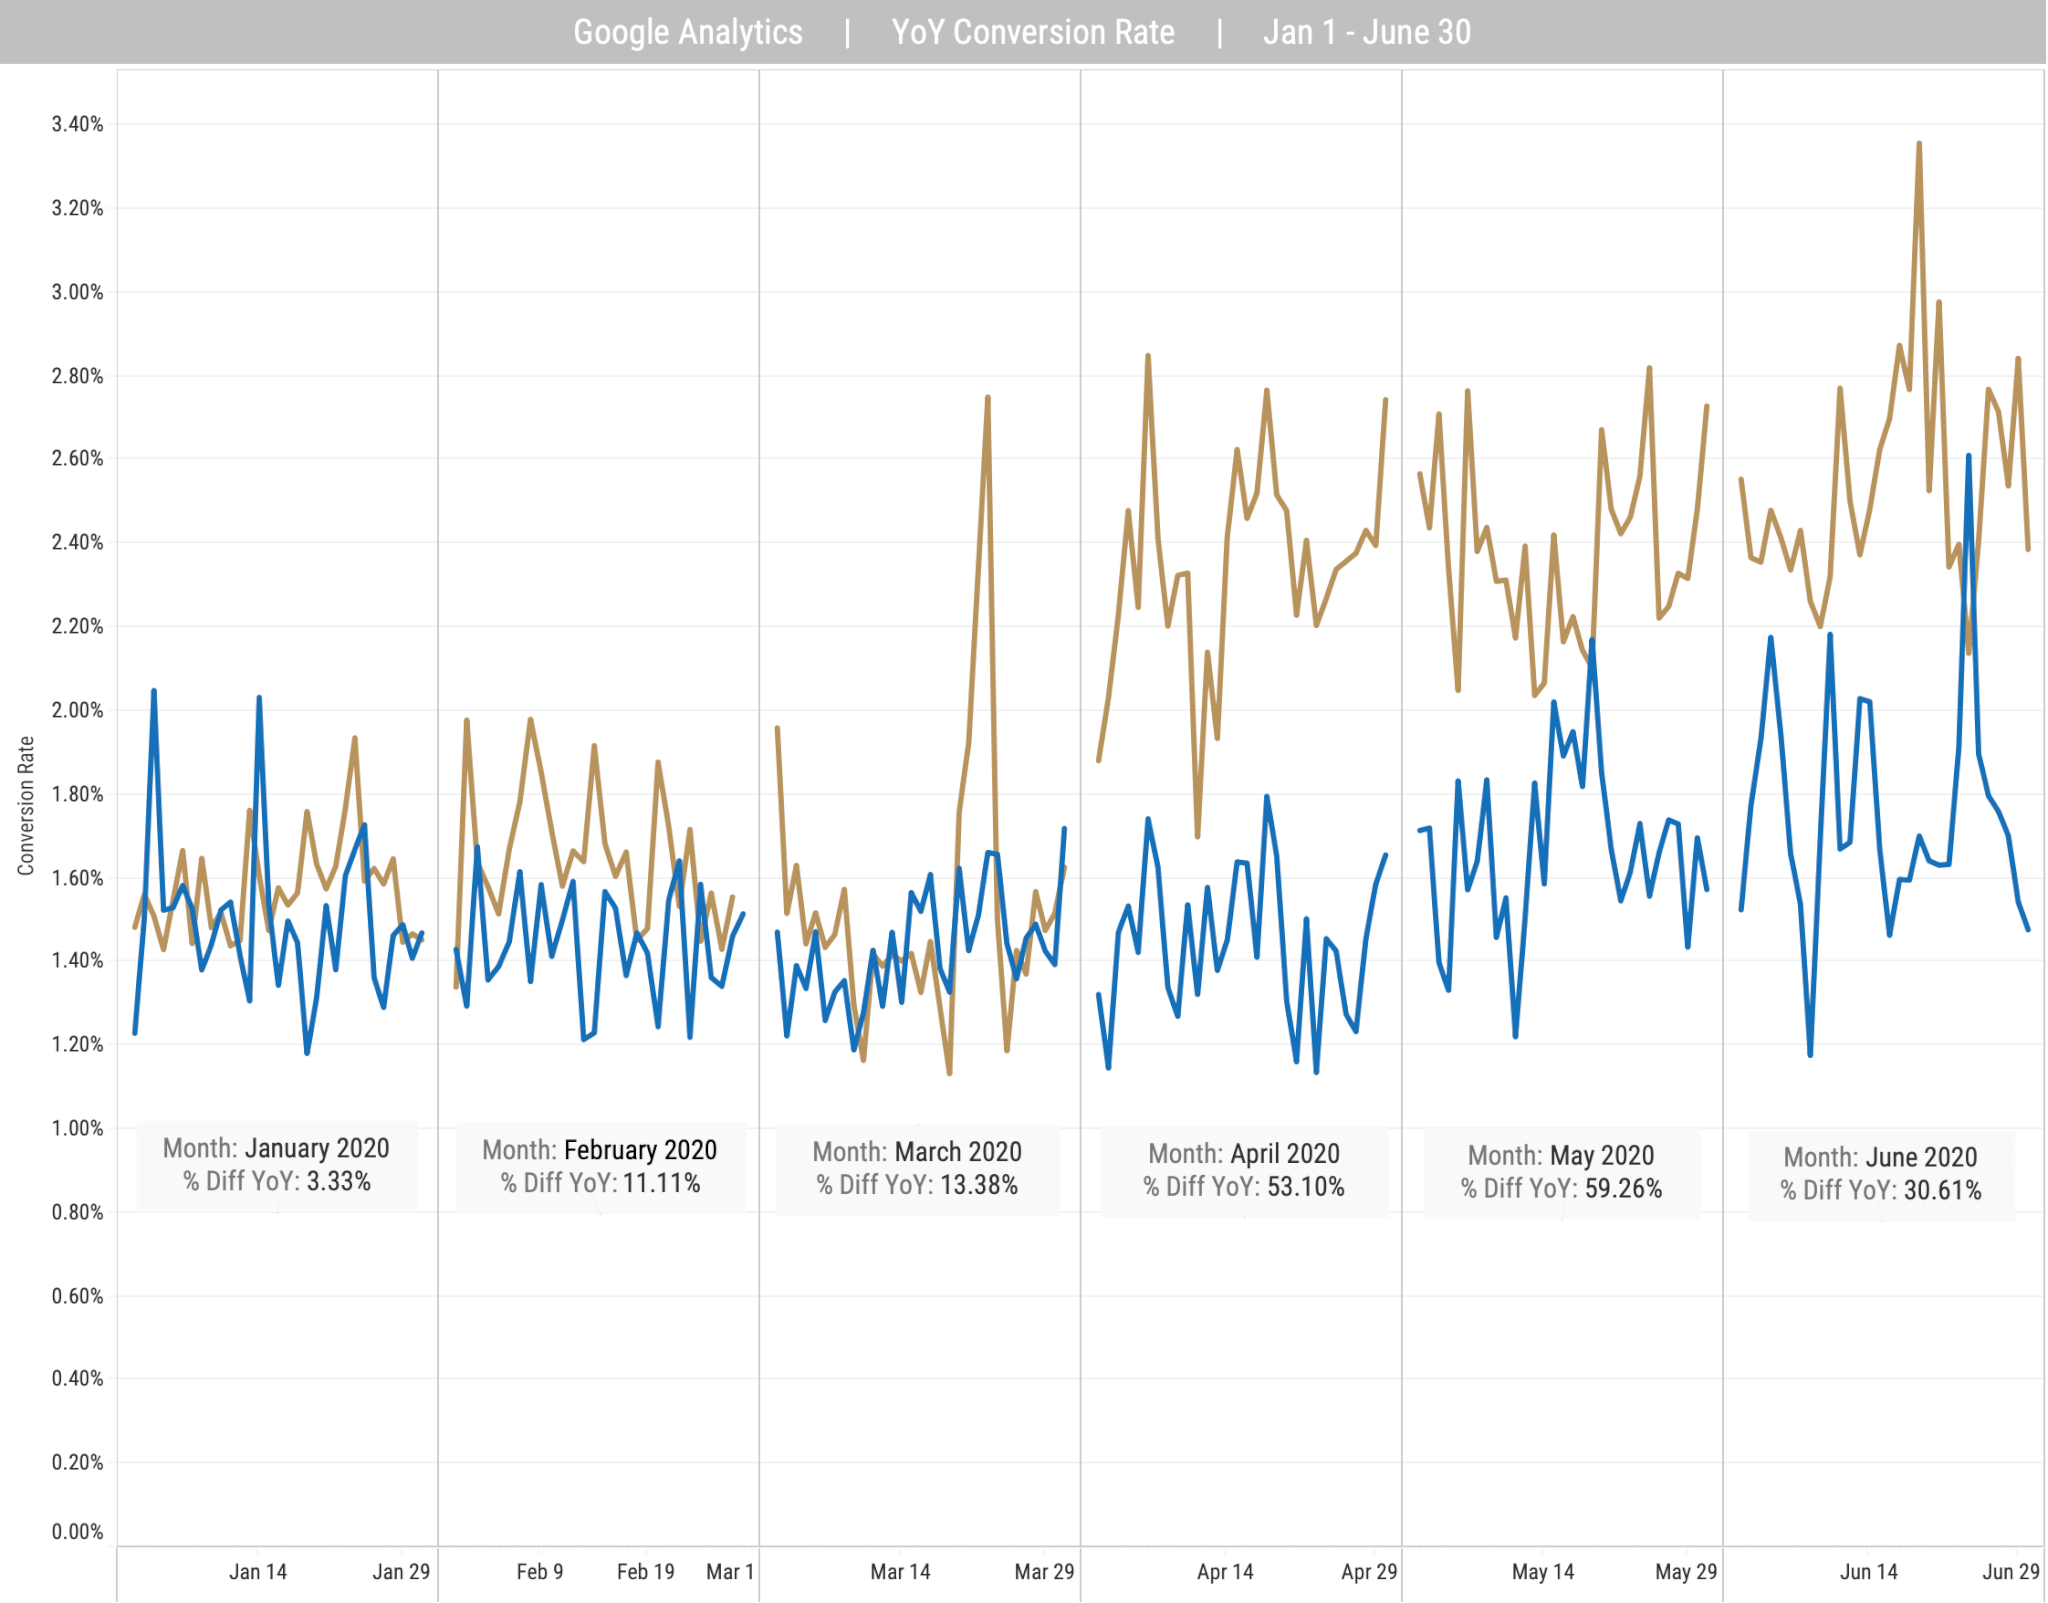
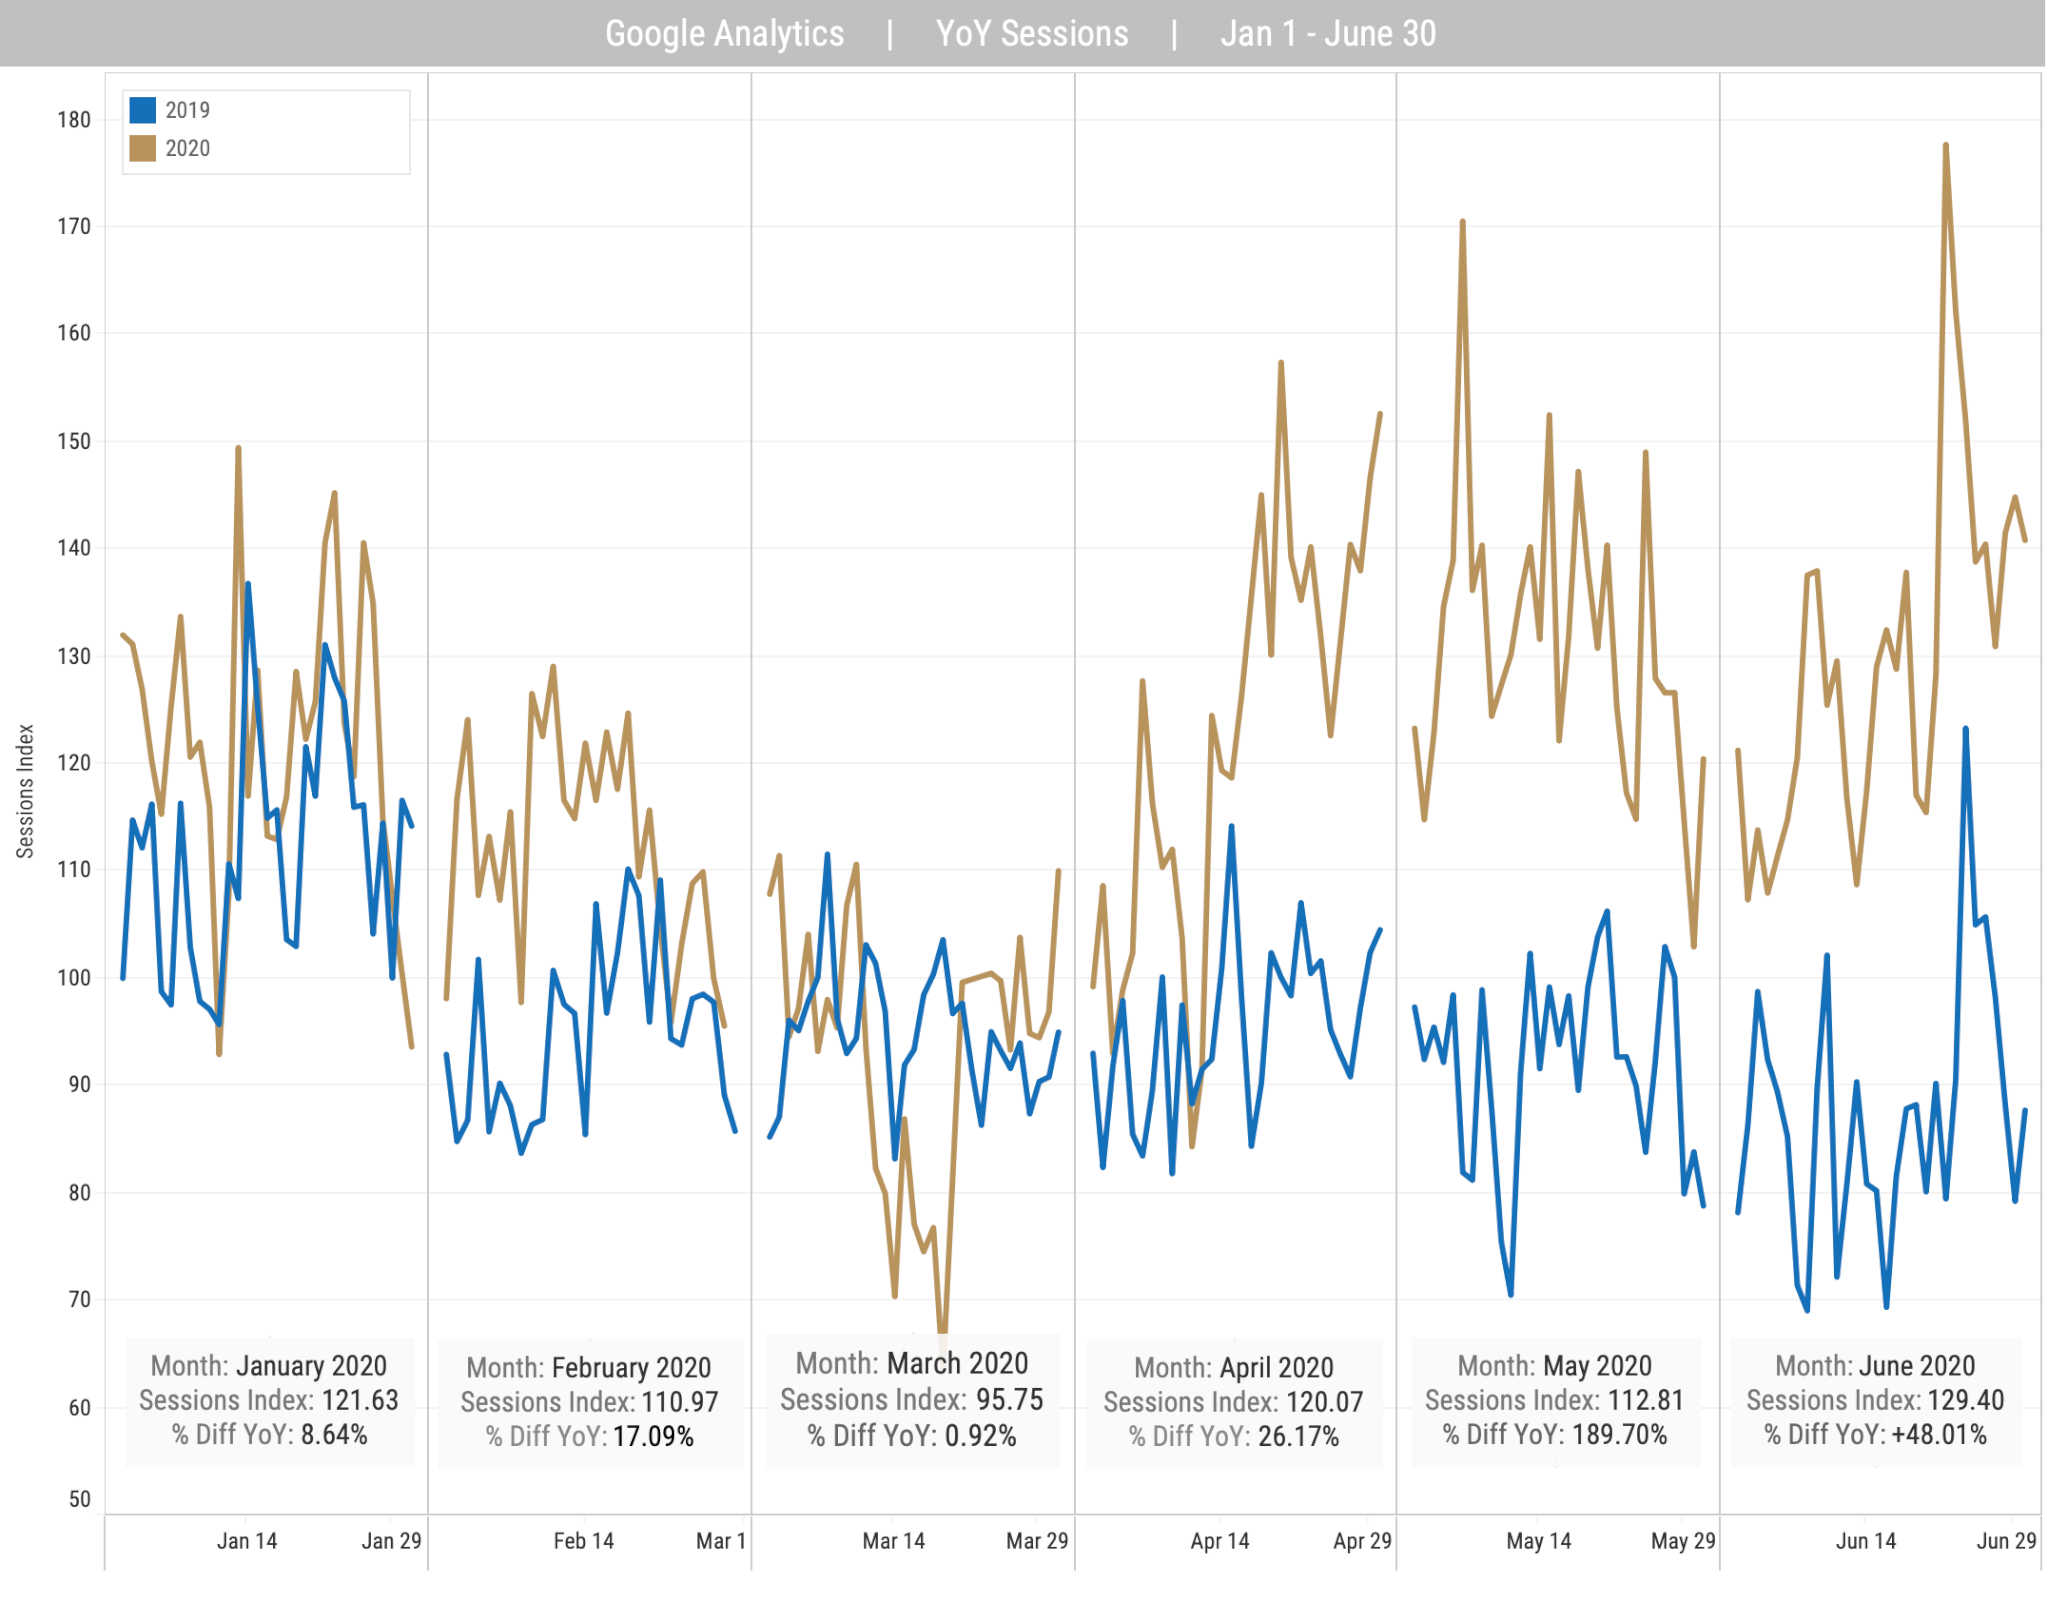
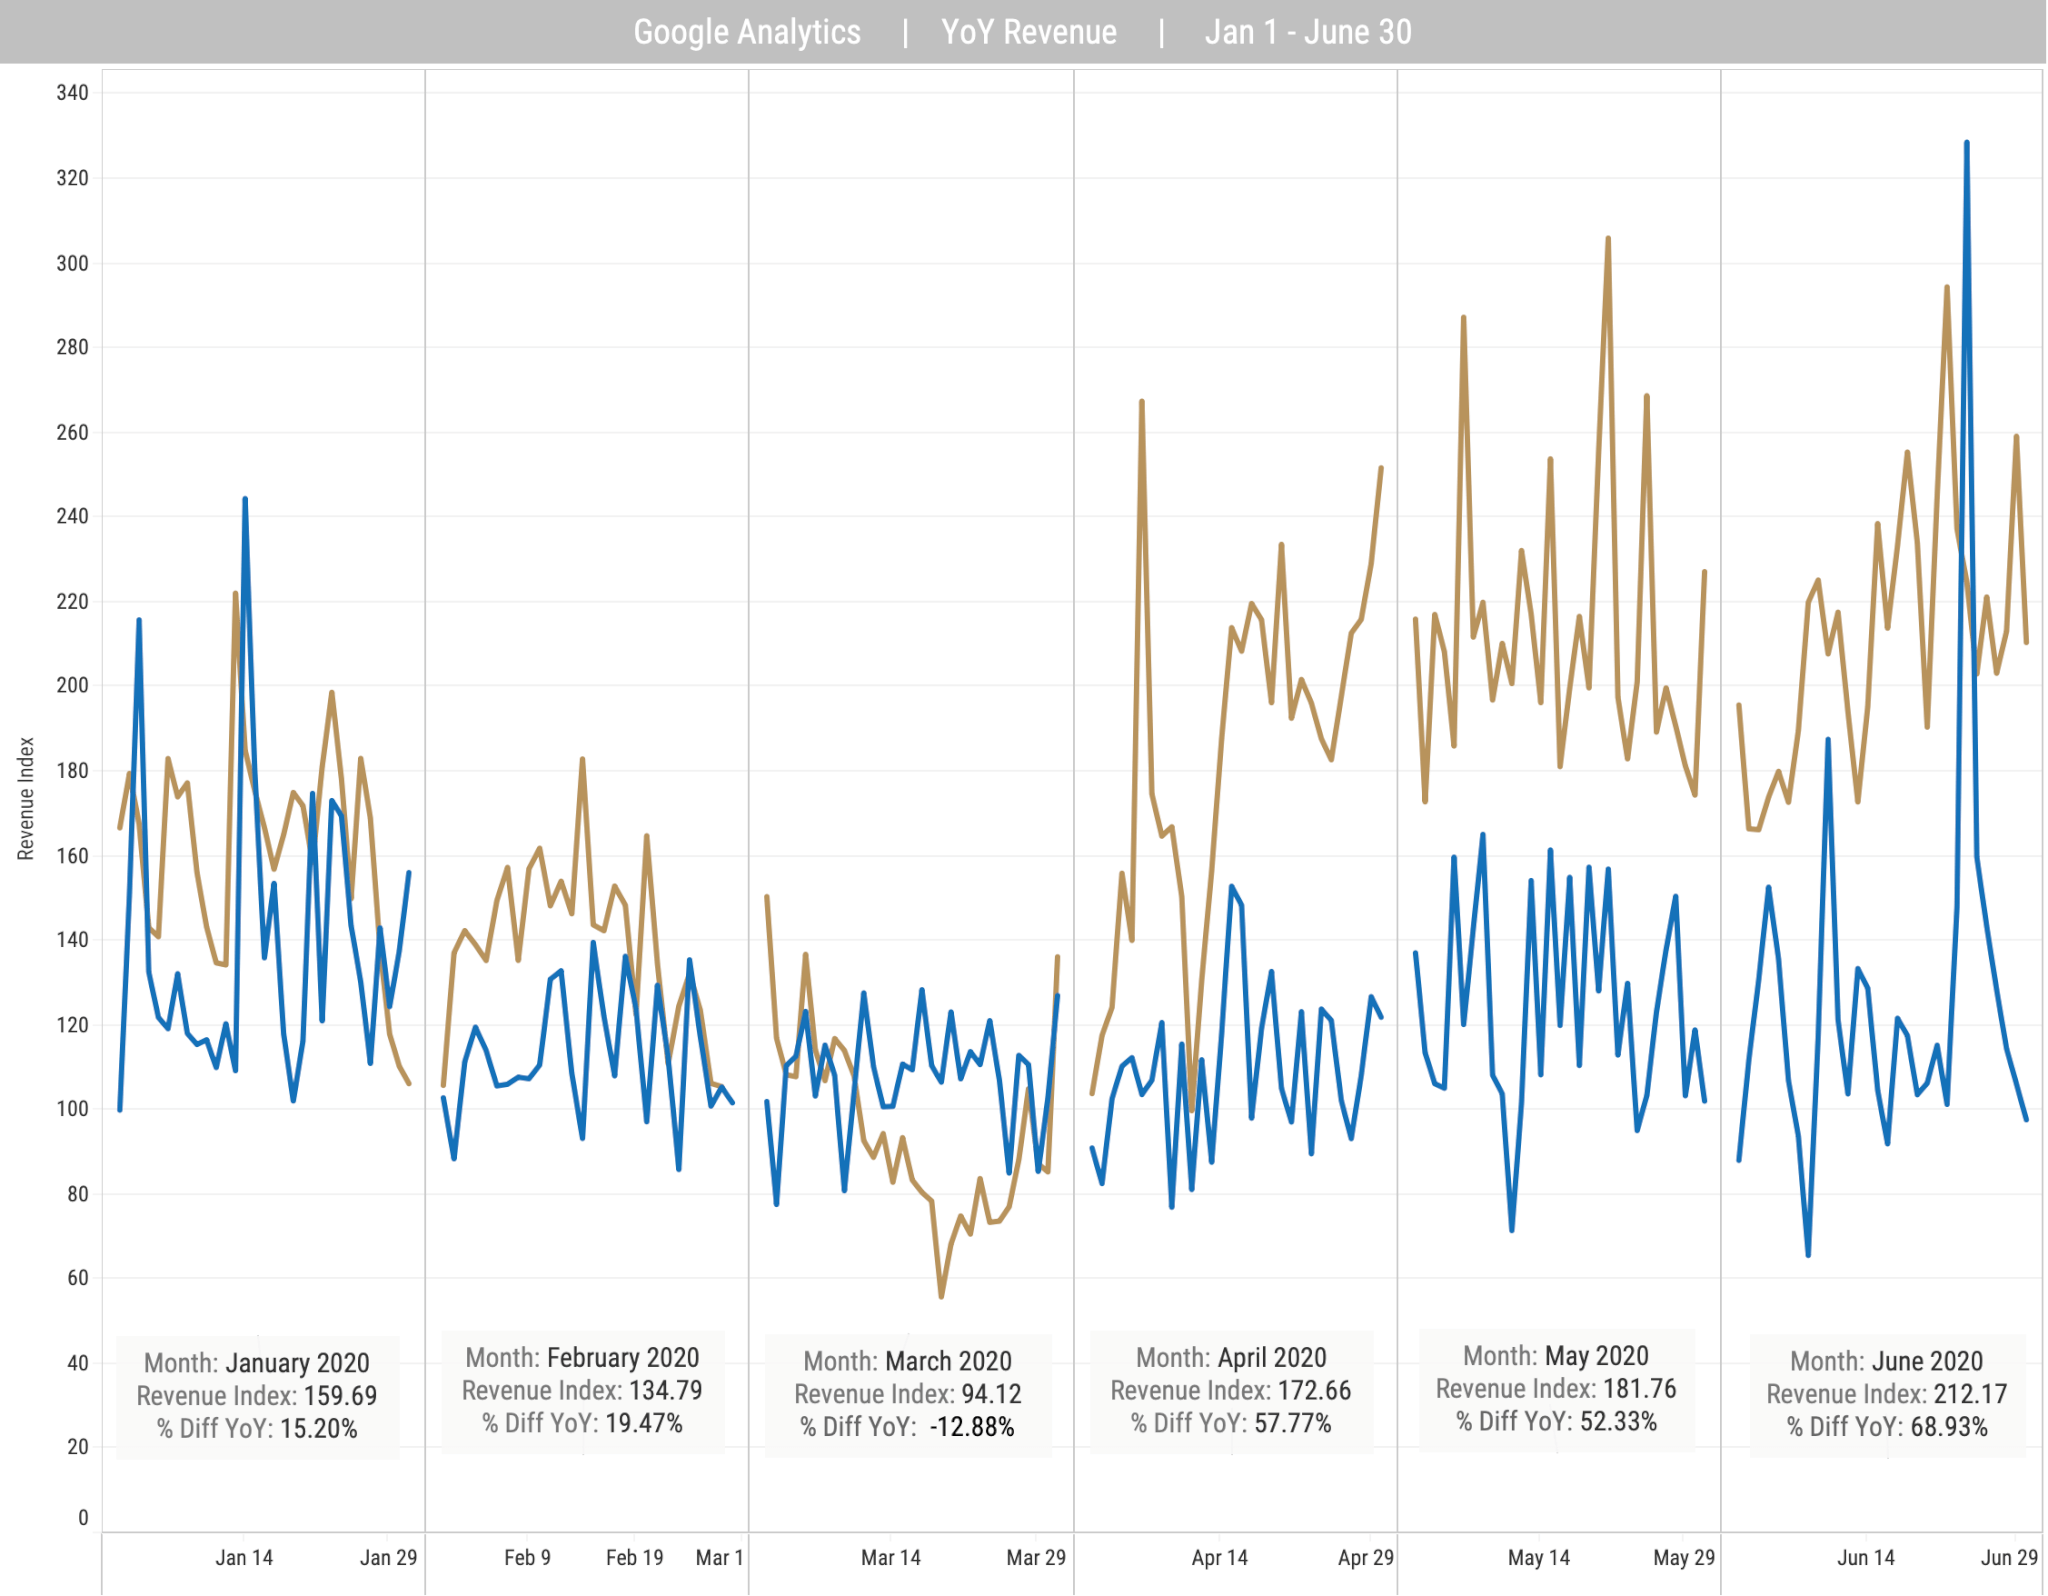
For Backbone’s roster of e-commerce clients, 2020 started off strong, with January revenue tracking 15.2% above 2019 alongside an increase in both conversion rate (+3.3%) and total sessions (+8.6%). February followed suit with even more impressive numbers compared to 2019, only to be met with challenges at the end of Q1 as we began to experience the impacts of COVID-19. We began to notice a slowing growth rate mid-March, and performance dipped below the same time period in 2019 by the end of March, which spoke to an overall trend of buying behavior slowing down. Throughout this period, we continued to think of ways to elevate our clients with the goal of keeping them top of mind when purchase behavior started shifting in April. In order to do so, we considered and recommended the following:
- Platform media was more important than ever due to the ability to swap creative, turn on and off campaigns and change targeting.
- Focus media spends on the platforms that are driving consistent and meaningful traffic to owned sites to close the traffic gap from non-paid sources.
- Shift budget strategy to max out audiences that are most likely to convert without allowing frequency to get too high.
- Continue to prospect, as large prospecting audiences were driving significant traffic, and the long-term benefit of acquiring a new customer can be a decent pivot during challenging times (i.e., looking through the dip).
- Be considerate of messaging given the global impact of COVID-19; consider content that can distract from the current landscape and provide positive value. E.g., provide an opportunity for people to explore camping/road trips/van life, get outside, get away from crowds, organize closets, build a capsule wardrobe, and more.
- Consider a regional approach to digital advertising spend to include or avoid areas hit hardest by the virus depending on products.
- Owned site traffic was declining while publisher site traffic was increasing. This presented an opportunity to leverage publisher site traffic for brands, whether that meant recirculating branded content through direct publishers or using branded content and/or earned coverage as paid placements to provide an additional touch point for consumers to engage with the brand.
- Although purchase behavior was slowing, overall media consumption was — and still is — up. We view this as a time to test additional discovery platforms like Pinterest and native advertising to drive brand awareness and engagement.
- To help offset the downward trend of Google Analytics sessions year over year, test ad creative with clear CTAs and/or promotions.
- Some clients saw success with philanthropic-centered campaigns.
April–June: Beginning to Rebound
Come April, the e-commerce clouds started to clear as we saw the first signals of shifting consumer behavior. April ended well above 2019 with a 26.2% increase in sessions, 57.7% increase in revenue and 55.2% increase in conversion rate year over year. This trend continued into May and June with an even higher growth rate over 2019, a promising signal that the outdoor industry is rebounding and that, with COVID-19 restrictions and social distancing still in place, consumers are turning their attention and dollars to outdoor recreation rather than traditional summer travel.
Digital Media Consumption Patterns and the Impact on Rates
With more people staying at home, it was no surprise that overall media consumption skyrocketed through Q2 2020, which also had a direct impact on the cost of media.
Increasing Media Consumption, Decreasing Costs
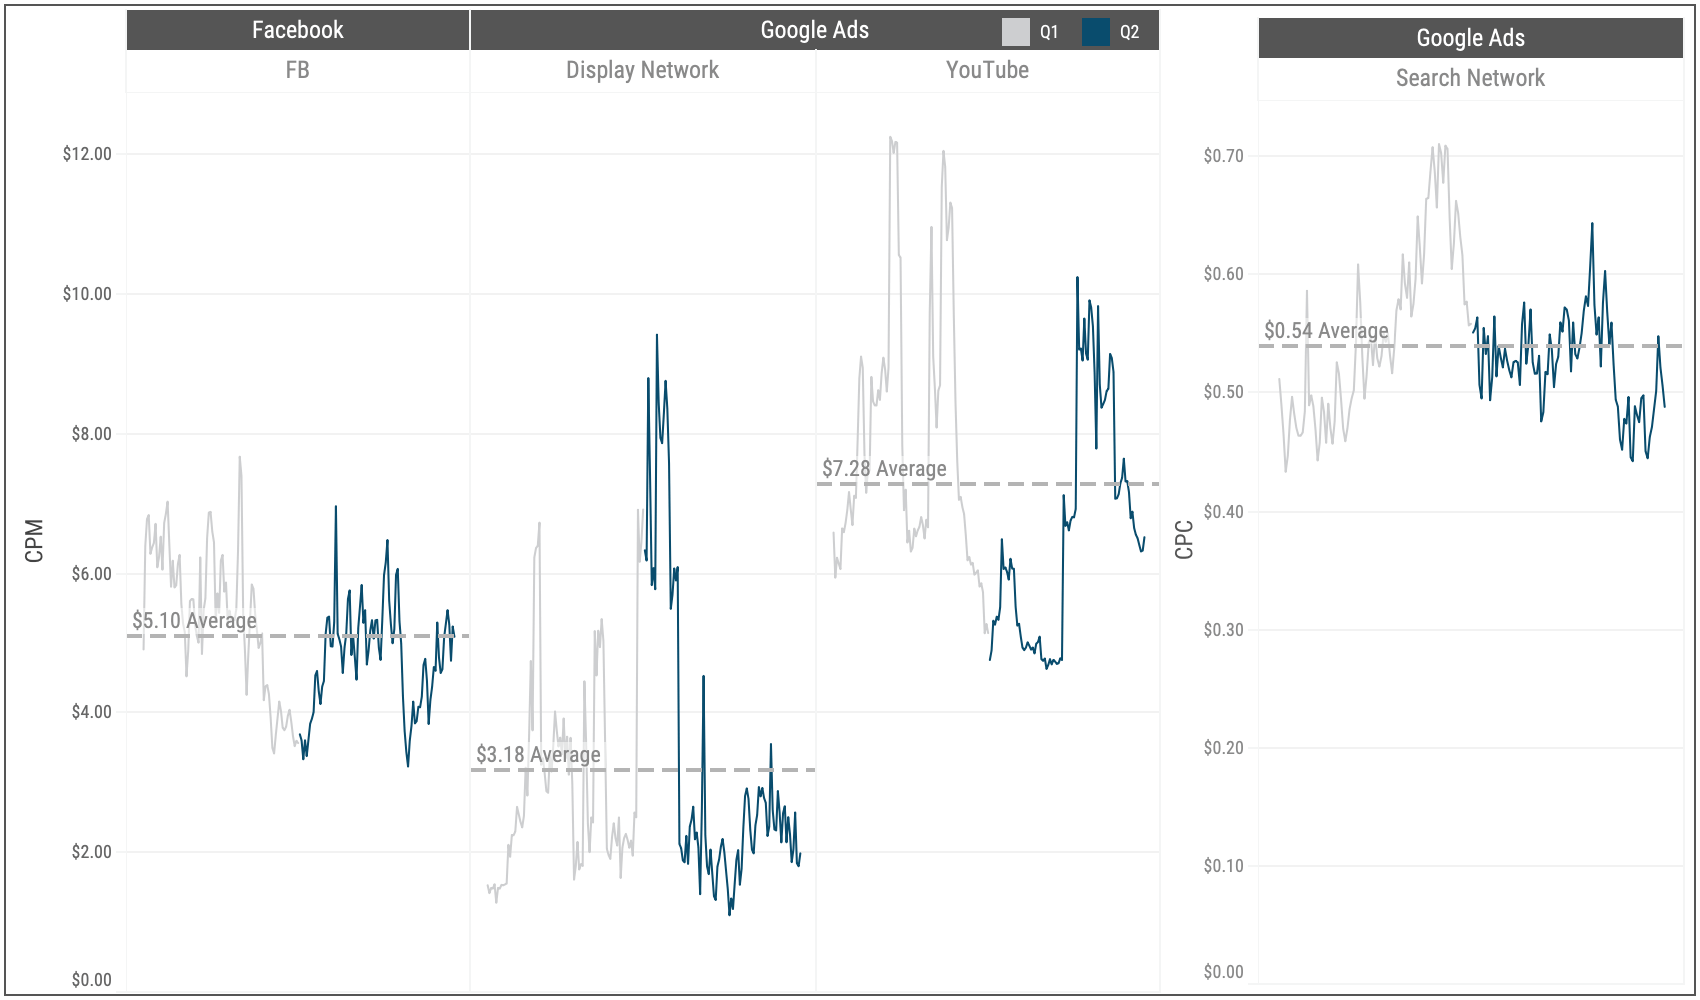
Through May, consumer media consumption was not slowing down and media rates became consistently more efficient across the board: Facebook CPMs were dropping (most noticeably in prospecting campaigns), YouTube experienced record-low cost per completed views, connected TV rates declined and affiliate commissions plummeted on Amazon. During this time, we experienced consumer purchase behavior beginning to climb and settle into a “new normal”.
Additionally, reports show that paid social platform CPMs have begun to increase again for prospecting campaigns while CPVs have continued to become more efficient across campaign types. It is becoming clear that consumers are increasingly more comfortable purchasing outdoor gear at this time while media consumption plateaus at a highpoint.
Paid Search: Branded vs. Non-Branded Costs
The initial COVID-19 shutdown in March led to increased competition within the paid search realm. Branded search costs increased because retailers were prioritizing branded search terms to try to shift online sales away from brand-owned sites to retailer sites in the midst brick and motor store closures. Conversely, this strategy drove CPCs down for non-branded and generic terms as retailers were focusing their spend on higher-converting branded terms.
Like other digital media, paid search CPCs started to level out in April and were at a level comparable to 2019. With that being said, non-branded CPCs have continued to trend below 2019 since the original dip in March. The efficiencies are likely due the aforementioned focus on higher-converting terms from brands and retailers.
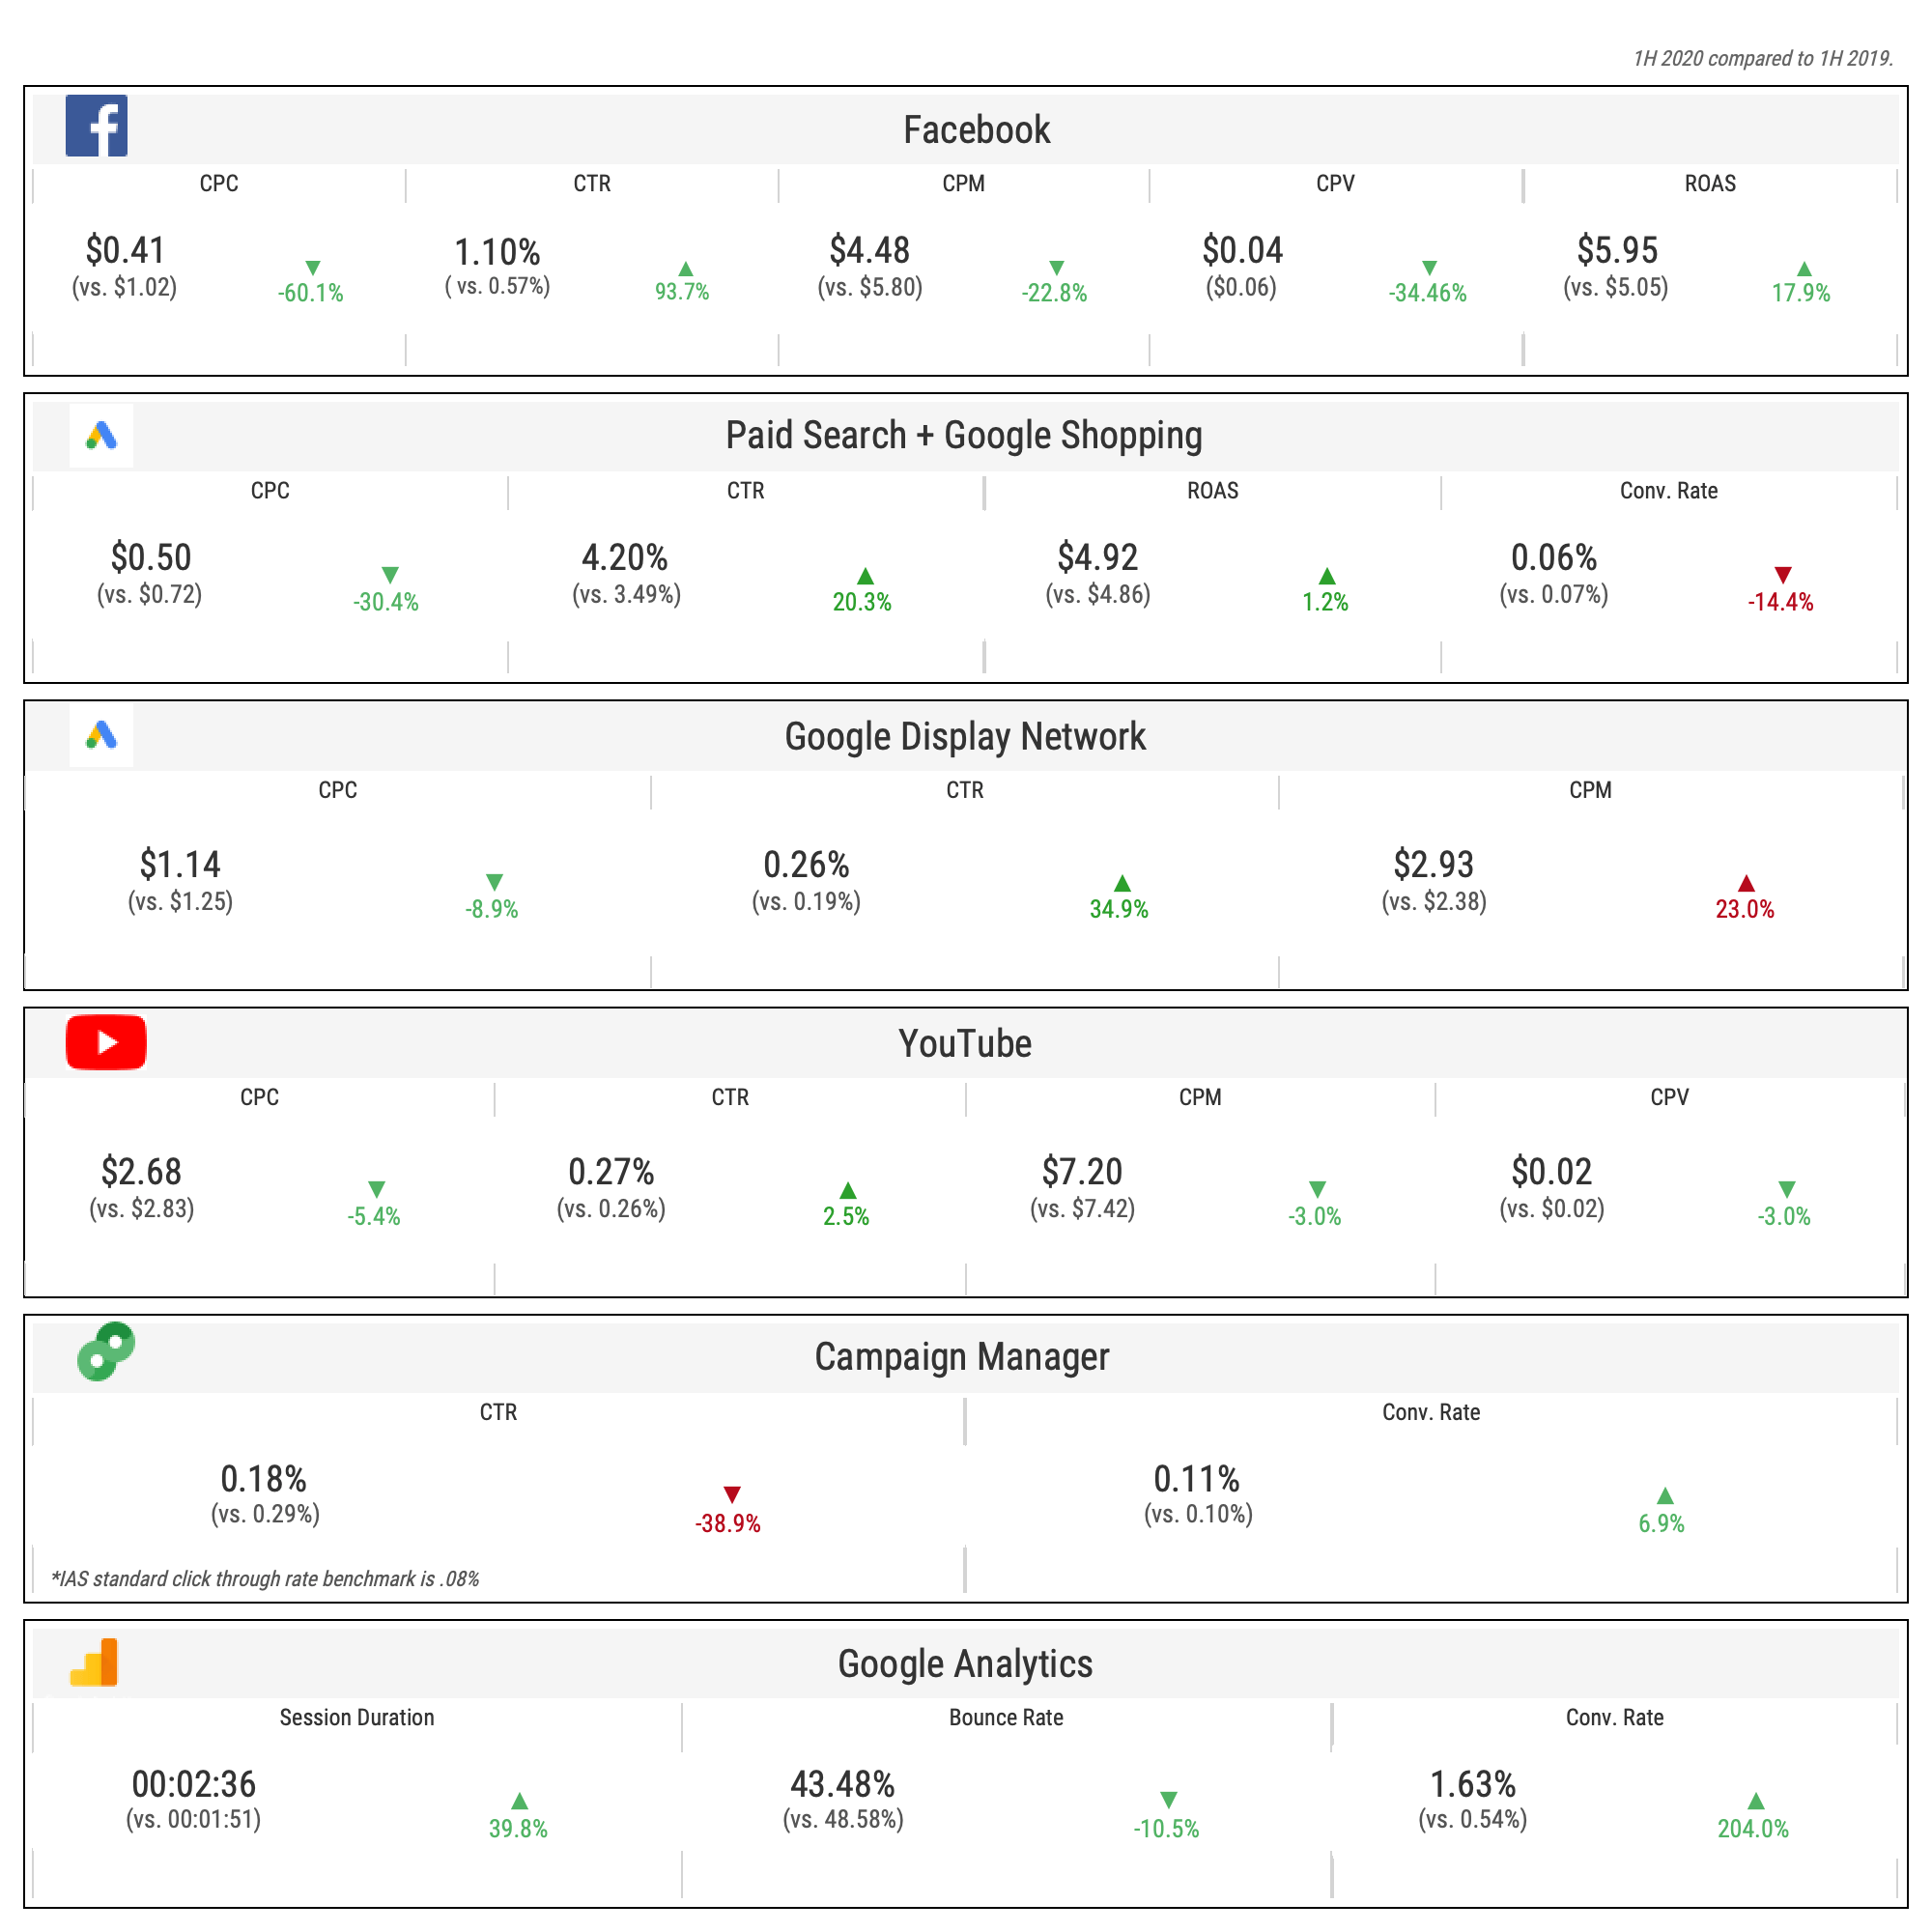
Year-Over-Year Digital Media Benchmarking
Specializing in performance media with a direct line of sight into the active outdoor industry, Backbone continues to monitor digital media trends and publish quarterly and bi-annual benchmarks by platform.
In most cases, we are experiencing efficiencies year over year in regard to overall cost, with the exception being low-funnel display advertising. Although it’s hard to know exactly what is driving CPMs up year over year within Google Display Network (GDN), theories include:
- Retargeting, which is responsible for a large portion of GDN spend, is becoming more competitive as brands are bidding on overlapping consumer groups and e-commerce activity increases.
- Google Smart Shopping is a large area of focus for Google and pushes impressions into GDN as one of the placements within its quiver. The increase in Smart Shopping-dedicated impressions drove overall display CPMs up year over year.
In addition to the changes we’re noticing in display CPMs, overall click metrics are declining, which represents a shift in user behavior. This has inspired Backbone to weight viewability and brand safety well above engagement metrics like click-through rate and cost per click, especially for static media placements like display banners, as they better represent the success of a less-than-engaging media placement.
Overall, consumers are signaling that brand engagement is king, as not only content consumption is up, but session duration is experiencing a 40% increase year over year combined with declining bounce rates and increased conversion rates (204% YoY).
Backbone Media’s Role in E-Commerce
At Backbone Media, we work full funnel, delivering from awareness to conversion and everywhere in between. We are here to help brands through different scenarios and navigate the unprecedented, disruptive and unpredictable times we’re experiencing in 2020. Thriving in the intersection of the right audience, at the right time, with the right investment, we’re able to find success for your brand and campaign goals.


