What does the data tell us about Instagram versus Facebook ad spend?

Many marketers have probably wondered at one point or another whether they should focus their paid social spend on Facebook or Instagram. And, beyond just considering one platform versus the other, what are the factors that go into allocating ad spend for various campaigns, audiences and at different phases of the consumer journey?
Backbone’s digital media and operations teams dove into the data, tested, learned, and assembled insights and recommendations to help answer these deceivingly complex questions.
Facebook Automatic Placements
In 2020, Facebook campaigns allocated 66% of spend to Facebook while Instagram received just 34% of the total spend.
Facebook recommends utilizing automatic placements, as it “enables [Facebook] to get the best results available from across all default placements.” Digging into this further, Backbone prospecting and reengagement campaigns gave Facebook 77% of the total budget, while Instagram received just 22%. For some clients, it was surprising to have the majority of their budget spent on Facebook when their target audience was more active on Instagram.
We tested this theory to find out if it was best to continue allowing the platform to optimize or to take an approach with a more controlled spend on Facebook and Instagram.
Client Example: Motivation
In particular, one client was seeing 99% of their spend allocated toward Facebook. We ran a two-week test with equal spends toward both platforms to analyze on-site behavior and key performance metrics.
Initially looking at performance results in Ads Manager, Facebook was the clear “winner” with a significantly lower link cost-per-click (CPC) and a higher link click-through rate (CTR), leading to nearly four times as many link clicks. However, on-site behavioral metrics showed Instagram users were on the site 4.9 times longer, had a 34% lower bounce rate, and had four times more goal completions.
The results showed us that we should continue to run on both platforms, while also testing allocating more dollars towards Instagram for a more expensive, yet higher-quality user that the platforms wouldn’t otherwise automatically optimize towards.
Learnings: Facebook versus Instagram
These learnings motivated our digital media team to do some digging and create a visual breakout across the two platforms.
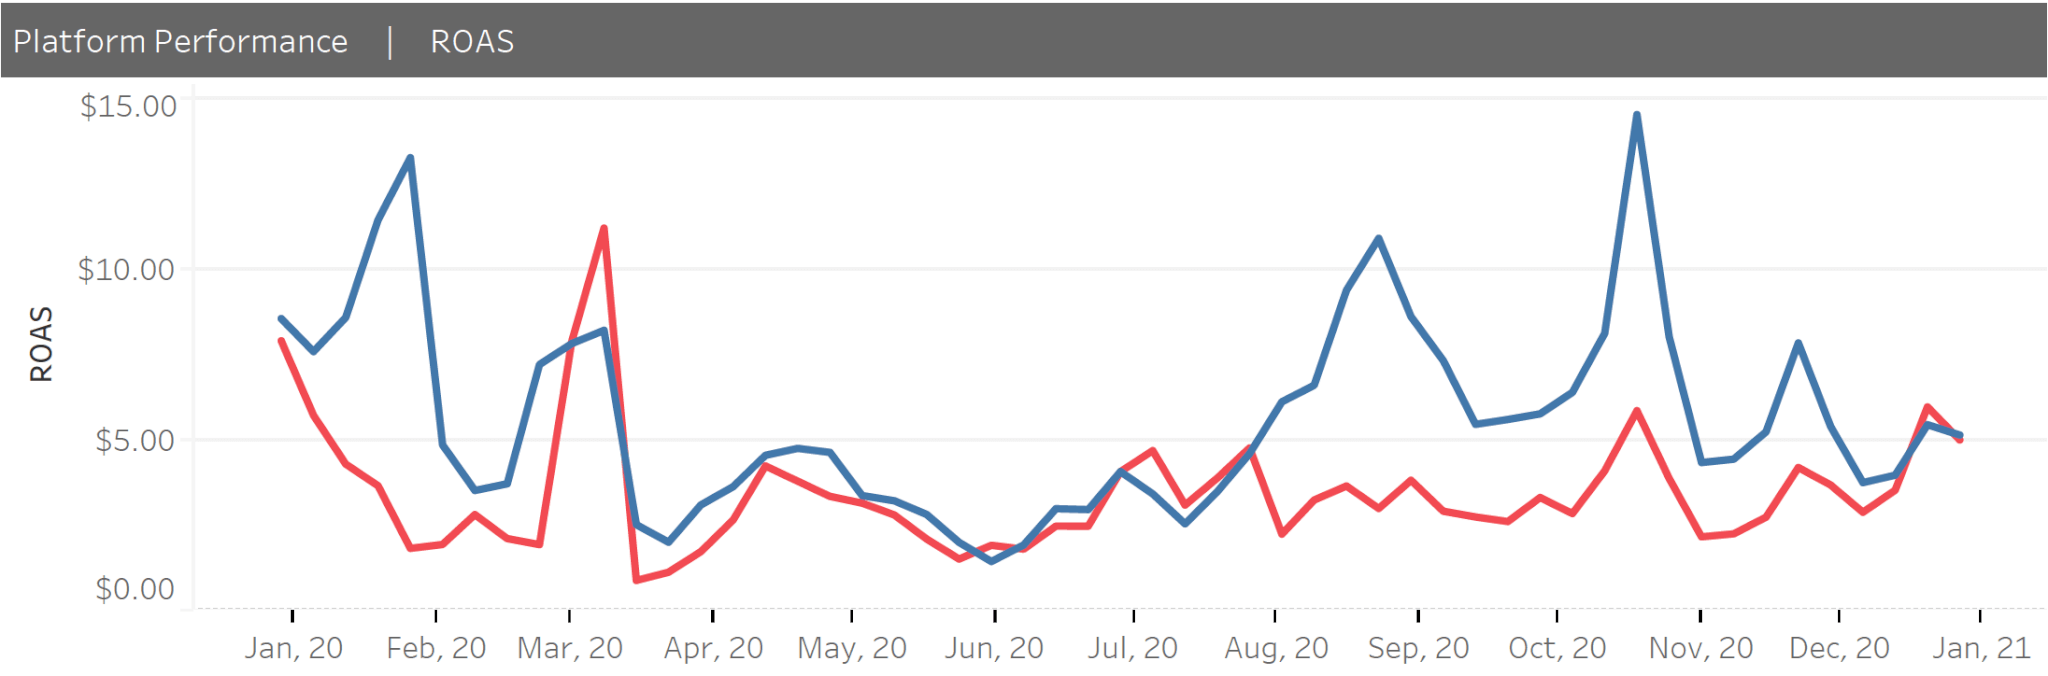
When looking across both platforms and segmenting by targeting tactic (prospecting, reengagement, and retargeting), there are multiple takeaways that incentivize us to test performance across Facebook and Instagram.
Across all Backbone direct-to-consumer clients at the prospecting and reengagement levels, excluding tourism and “for-cause” clients, Instagram ads held a higher overall link cost-per-click and a lower click-through rate. However, Instagram ads held a stronger overall Return on Ad Spend (ROAS) in addition to a higher Average Order Value (AOV) compared to ads served on Facebook.
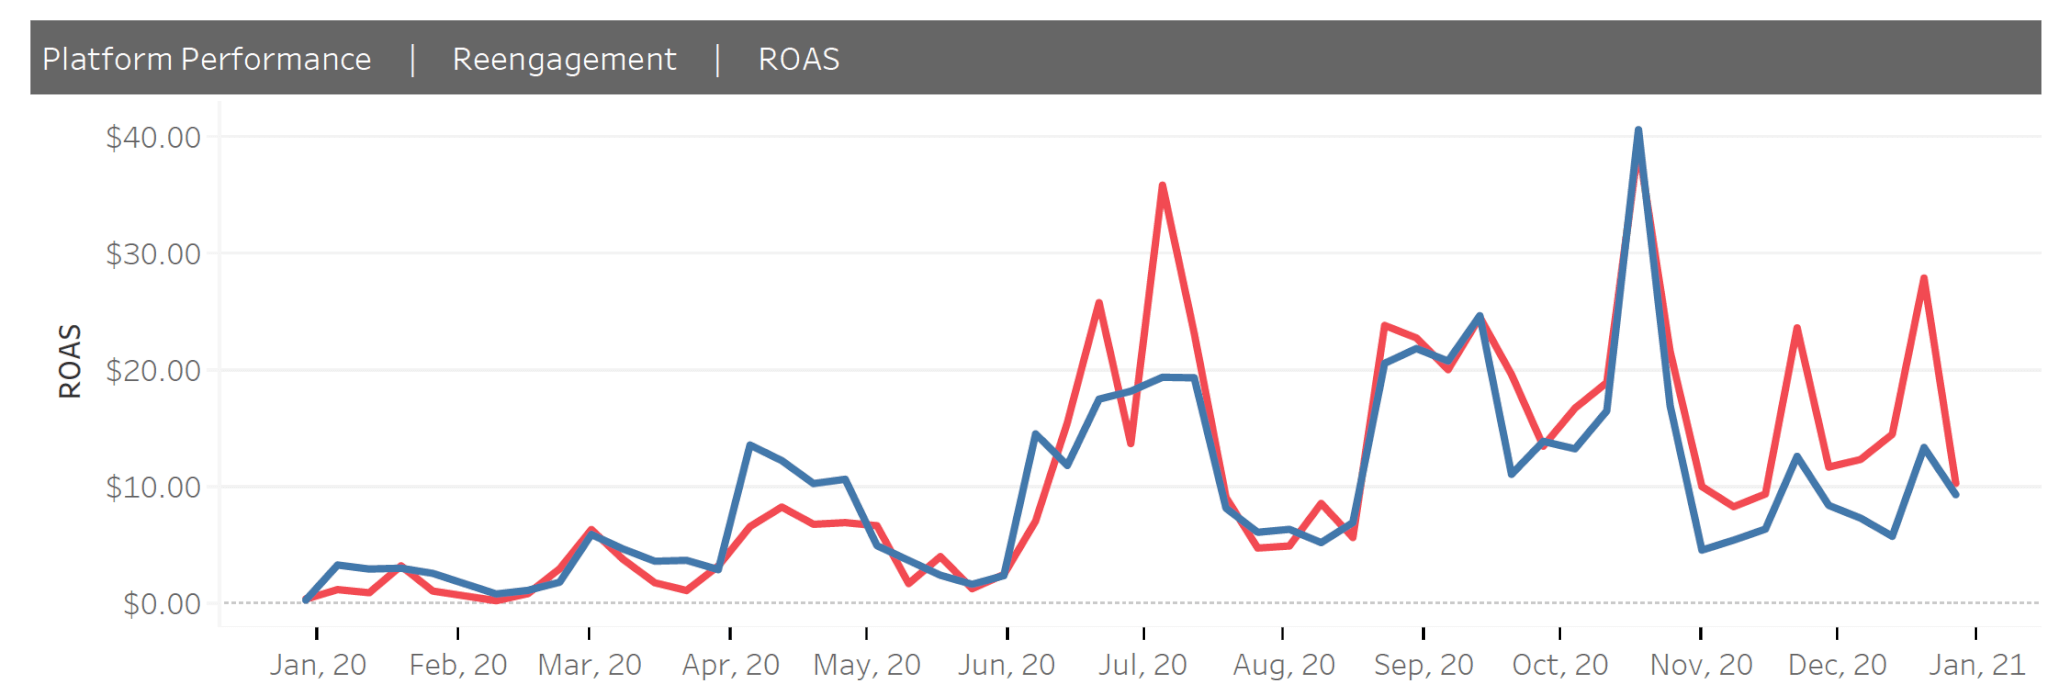
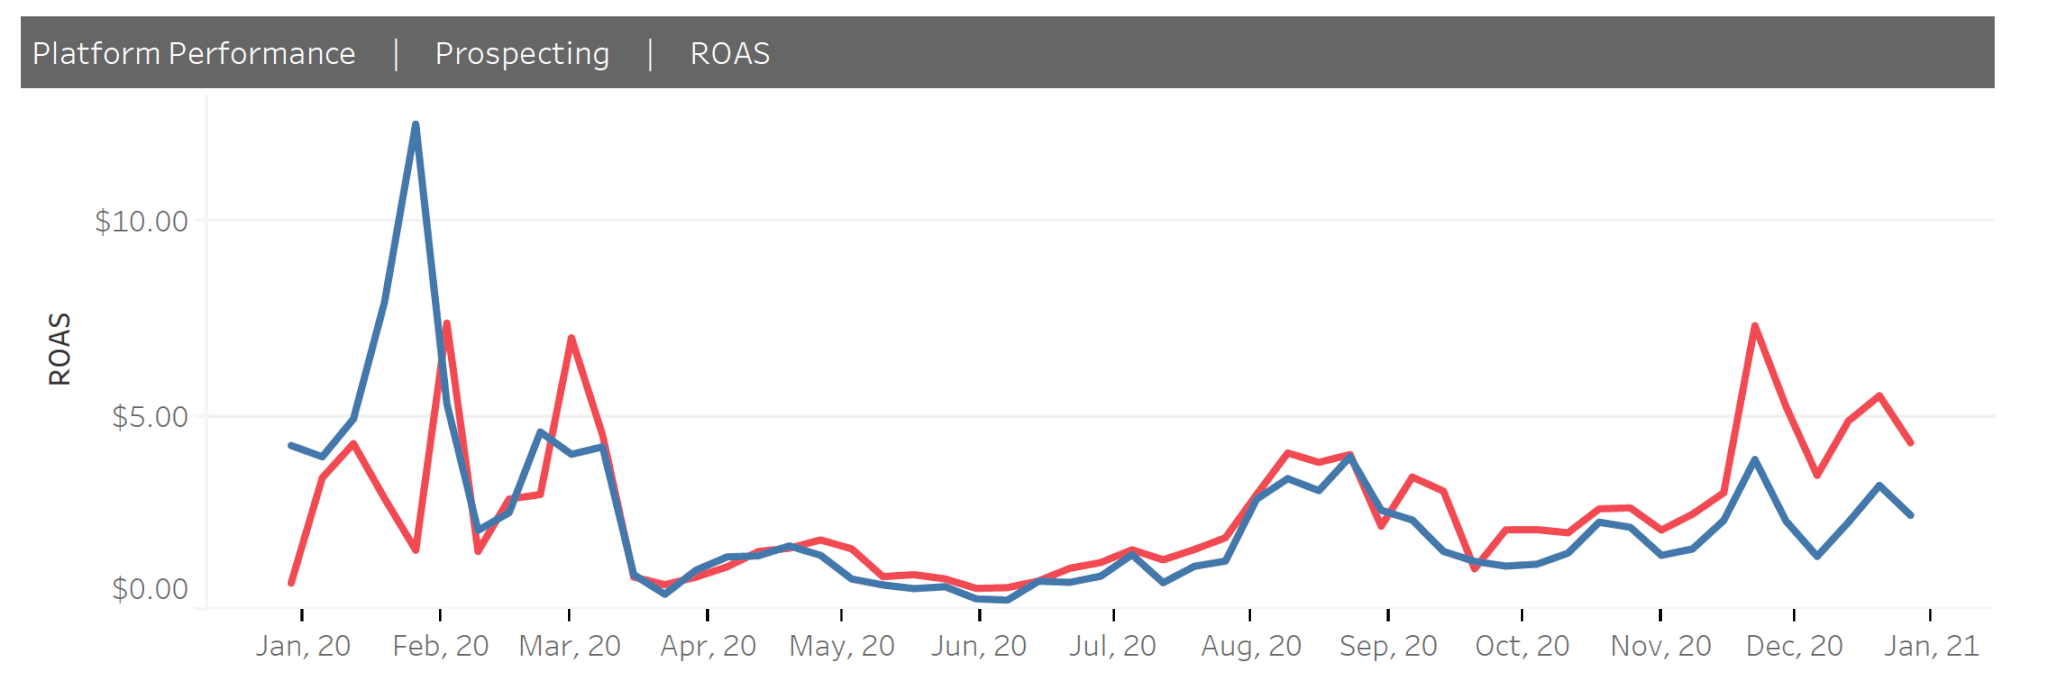
At the lower/retargeting level, Facebook edges out Instagram ad performance slightly, but they essentially have the same link CPC and AOV.
Additionally, it’s worth noting that users at the retargeting level typically comprise an advertiser’s core audience and are more motivated to make a purchase. With Instagram’s lower-performing engagement metrics (CTR and CPC) but higher return metrics (ROAS and AOV), we recommend exploring the spend breakout across the two platforms with each Facebook campaign, especially if there is a mix of Instagram and Facebook placements turned on.
Considerations
- Determine the spend breakout across Facebook and Instagram placements. Is it extremely unbalanced? Who are the main demographics (specifically ages) that our ads are serving to?
- Look at behavioral metrics (bounce rate, pages/session, average time on site) on Google Analytics and compare those users coming to the website from Facebook versus Instagram.
- Run a small test that spends dollars evenly across the two platforms and monitor performance.
- Ensure that spend distribution is appropriate (with justifiable quantitative results) across both Facebook and Instagram.
Conclusion
While we are not recommending shifting all dollars to Instagram or vice versa, this study is an important reminder to check that campaigns are serving at a desired level on both platforms as we continue to monitor and uncover new trends across the social media landscape. The results we discover may open the door to reach new users and boost overall returns, especially at the prospecting and reengagement level.
This report on Instagram vs. Facebook ad spend from Backbone’s digital media and operations teams is part of a series of updates that provide data-driven insights and experience-based anecdotes to help brands and marketers. If you have feedback or questions, please send us a note at info@backbonemedia.net.


